
Understanding the Business Intelligence Lifecycle
How Does The BI Lifecycle Work?
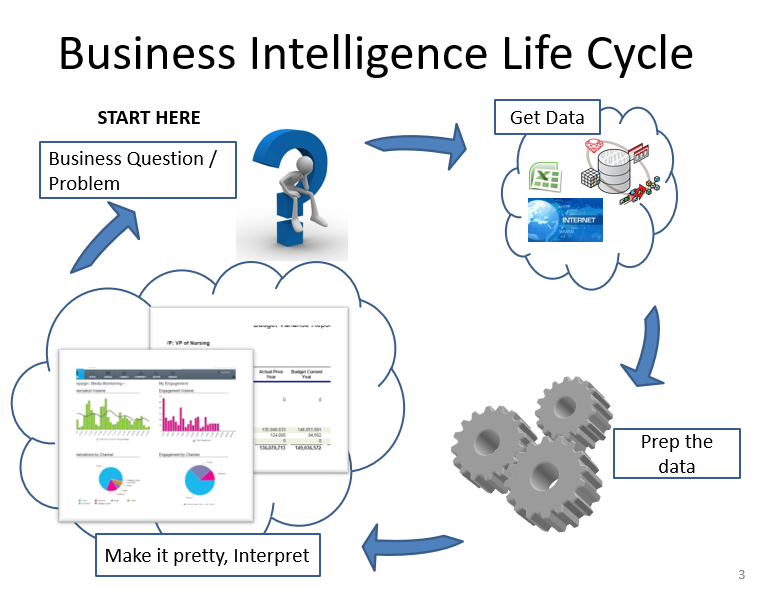
If we think of the maturity model as the different levels of BI in a company, or the destinations of where we want to arrive, then the BI life cycle is how you get there.
I split this into the 4 steps shown below.
While each BI project could be considered “Done” when the reporting is delivered and implemented, more often than not, there are additional questions and value to be derived from data.
- Step 1 – It starts with a question or problem
- For sake of example that should be pretty universal, let’s say the problem is “We need more customers.”
- Step 2 – Identify what data is available
- For our example, we could look at our sales history, marketing automation, or CRM (Customer Relationship Manager). Any sources that track the movement through the marketing or sales funnel would be great sources to start with.
- Step 3 – Prep the data
- A list of sales and a list of customers is helpful, but in this stage, we’re going to do what’s called “Modeling The Data,” or making it ready for use in the reports. For our sales example, maybe we’ll have one row in the “SalesAndMarketingFactTable,” we create in this step for each customer, for each month, and totals of how many emails we sent them, they opened, they responded to, and how much they purchased in that month or the next month. This gets to sound a little complicated but is easier to understand with real examples.
- Step 4 – Build reports (i.e., make the data pretty and digestible)
- In this step, we are taking our prepared data and laying out reports for each month with sums of sales and counts of emails sent/opened/responded—as well as potentially customer level reports showing activity by month. This can be used to group customers together, or maybe even identifying popular products and cross-sell opportunities.
- Step 5 – (Optional) Verify data and repeat
- Would be to verify our information is giving sales, or marketing the information they need to ACT. Do we need to package products, or better time and craft our marketing emails? This could start the process again with a deeper dive into key areas or identify other data to go after to ensure our new sales are getting a strong enough margin.
How Does The BI Lifecycle Work?
Gartner came up with this Business Intelligence Maturity Model.
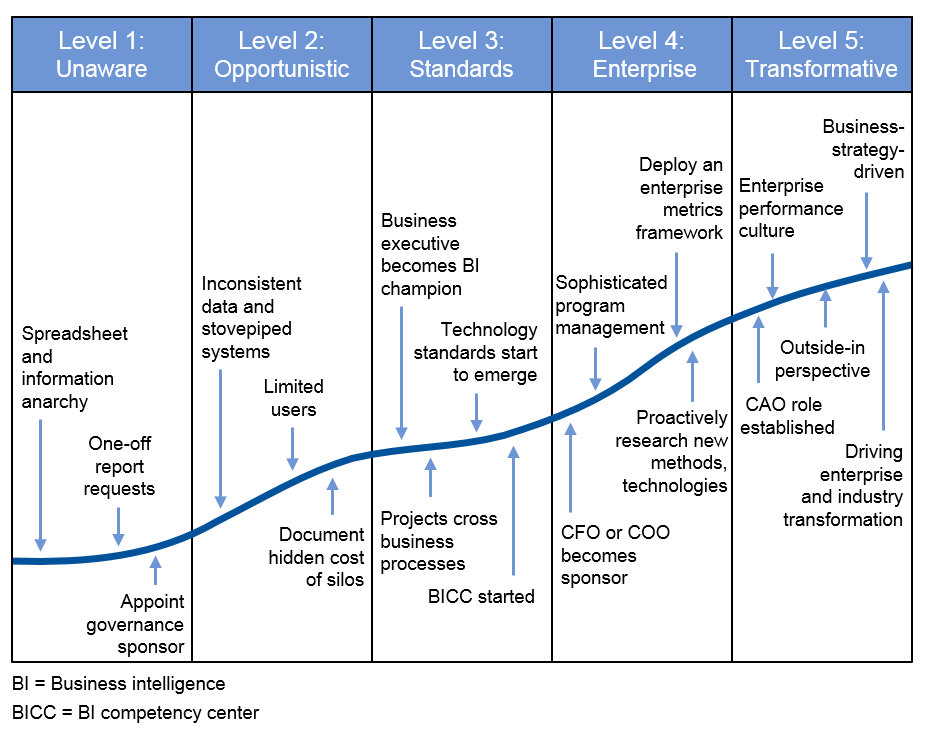
I’ll call out some common steps I’ve seen in my experience.
- Level 1 –
- Operating from “Gut” or “Owner experience,” if any reports are used, they’re mainly created for one-off specific uses. They take a lot of time to create and aren’t widely trusted, because there isn’t much validity in the underlying data.
- Level 2 –
- People/Companies at this stage have used reports and might even re-build reports again and again. Often these only look at one functional area of data (Operations reports, Financial reports, but not a blended report showing actual financials and operations data together).
- Level 3 –
- Companies are re-using reports or are refreshing reports with new data regularly. These reports are becoming key to decision making. More leadership engagement starts to emerge.
- Level 4 –
- Alignment across the enterprise on what is considered “Trusted Data.” While Subject Matter Experts (SMEs) own individual data sets, (Accounting, Operations, Marketing), senior leadership is driving the project and ensuring it alights to overall company goals.
- An example would be ensuring a company-wide gross margin and bottom line accounting number versus trying to get X number of widgets sold.
- Level 5 –
- At this stage, you’re no longer using reporting to describe what’s happening. You’re using it to predict what might happen based on what you know has happened before. You’re also potentially creating “Prescriptive” reporting, where leadership can do “What-If” analysis to compare the impact of various decisions. It takes a lot of work and focus to achieve this level of BI across an organization.